
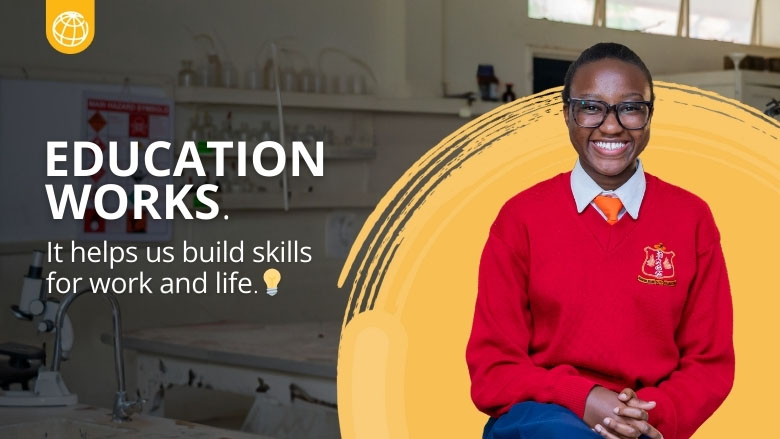
Education is the foundation to skills development and jobs, and the surest way out of poverty, empowering generations to earn an income and drive economic growth. A good education equips learners with key foundational skills—literacy, numeracy, and socio-emotional competencies—which are essential for work and life. These skills help today’s children become tomorrow’s productive workers and enable workers to reskill or upskill later in life. The World Bank Group is the largest financier of education in the developing world, with a $26.4 billion portfolio across 81 countries, supporting 324 million students to date with better education.
On this International Day of Education, we look at why education works, and how it helps propel people out of poverty, putting economies on a path to growth.
“Credit: World Bank Group. All rights reserved”
 decline. However, looking at global averages is not enough to understand this trend, as this decline has not been evenly distributed. We break down the world population into two groups (measured through either income or consumption expenditure): the bottom 40% (the poorest people in any given country) and the upper 60% of the income distribution.
 training, and over 875 million people are expected to
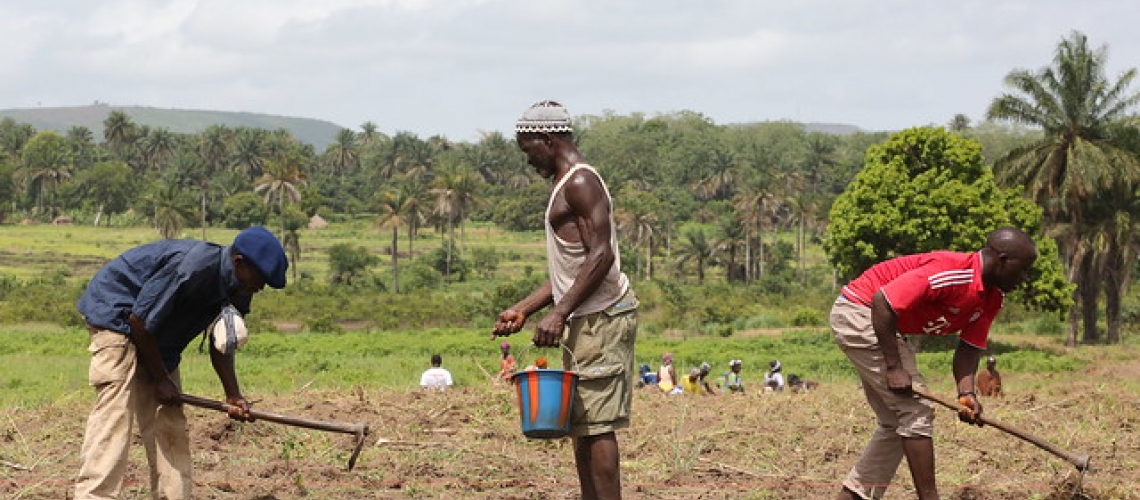
  Creating more and better jobs is central to our work at the World Bank and a shared goal for virtually all countries —developed and developing alike. But oftentimes the policy debate turns to the cost and effectiveness of programs and projects in creating jobs.
 estimates of gross national income (GNI) per capita for the previous year is revised. As of 1 July 2016, low-income economies are defined as those with a GNI per capita, calculated using the
You must be logged in to post a comment.